ISMS 28: Stocks for the Long Run
Listen on
Apple | Google | Spotify | YouTube | Other
What long-term return do you expect for US stocks?
If you’re investing for decades, not months, one question matters more than almost any other:
What long-term return should you realistically expect from the stock market?
That’s the exact question Andrew explores after reading Stocks for the Long Run: The Definitive Guide to Financial Market Returns & Long-Term Investment Strategies by Jeremy Siegel, one of the most respected books on long-term investment returns and financial market history.
The answer might surprise you.
The big number: a 5% real long-term return
According to Siegel’s research spanning more than two centuries, investors should expect roughly:
5% annual real return from US stocks over the long term.
“Real return” means after inflation. This is the number that truly matters because it reflects your actual increase in purchasing power.
Historically, that number has been remarkably stable across time periods, wars, recessions, and economic transformations.
US nominal vs real returns: why inflation changes everything
One of the most powerful examples in Siegel’s research is simple:
- Invest $1 in US stocks in 1801
- Hold it until 2021
The result?
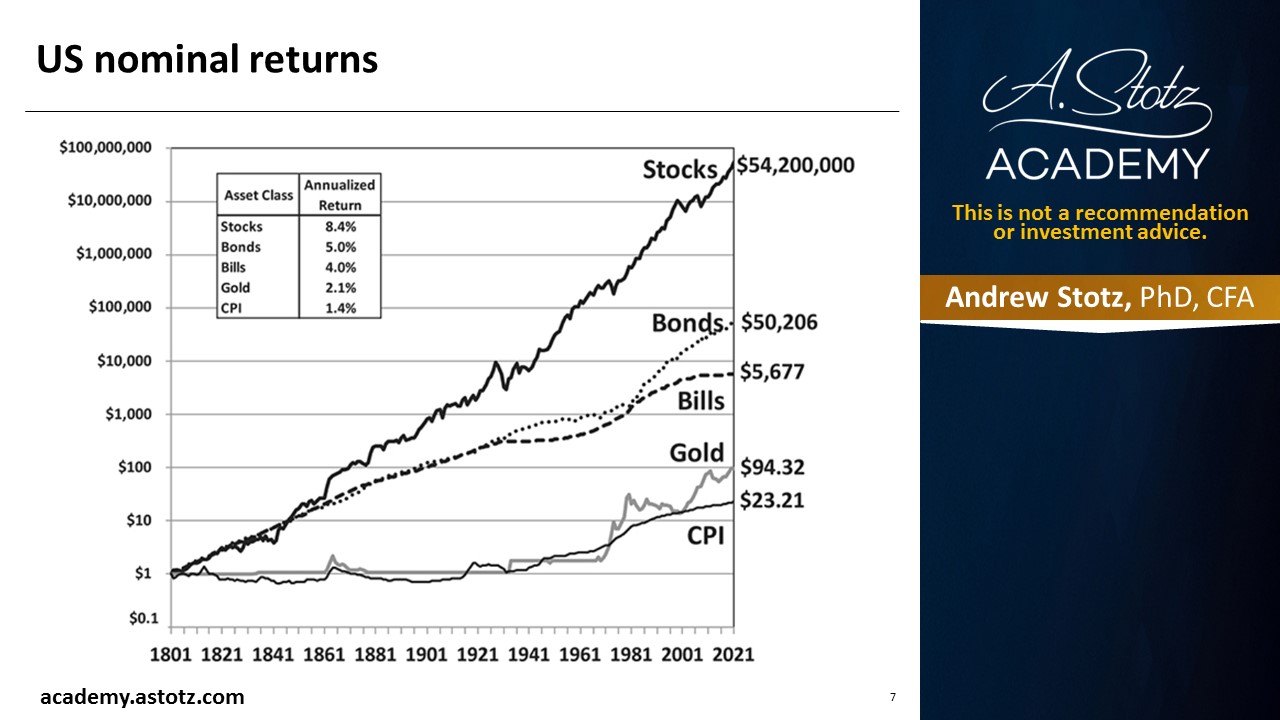
- Nominal value: $54 million
- Real (inflation-adjusted) value: $2.3 million
That difference highlights one crucial investing lesson: Inflation quietly erodes wealth over time.
Understanding real returns vs nominal returns is essential for anyone investing for retirement or long-term financial security.
Stocks vs bonds vs gold over 220 years
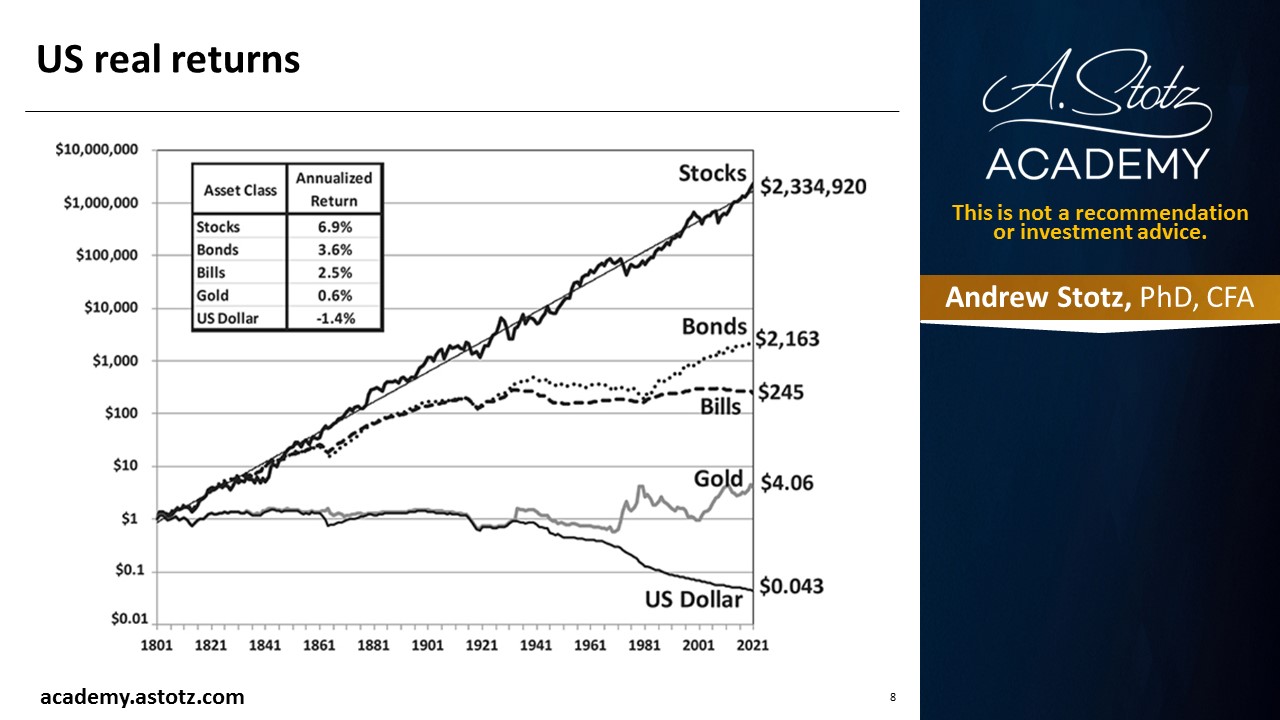
When comparing long-term asset performance from 1801 to 2021, the differences are striking:
Real Annual Returns:
- Stocks: 6.9%
- Long-term government bonds: 3.6%
- Short-term government bonds: 2.5%
- Gold: 0.6%
Over two centuries, stocks dramatically outperformed every other asset class, confirming why they remain the cornerstone of long-term portfolios.
To give you an idea of the real return here, if you had invested the $1 in long-term government bonds, you would have ended up with $2,000. If you had invested in US government bills, which are short-term interest-rate instruments, you would have gotten $245.
If you had invested in gold, you’d have only $4 of real return. Gold, in fact, is not and never has really been a great investment vehicle over the long term, though it helps during periods of shocks.
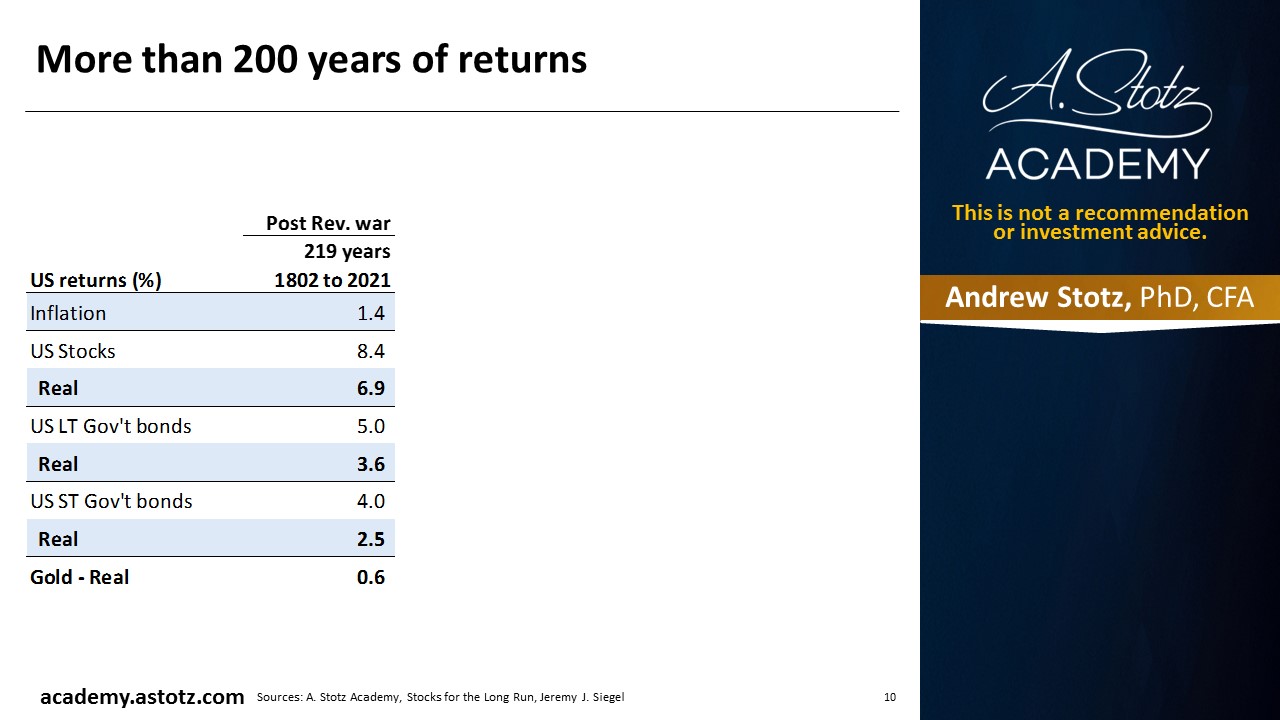
Over that period, inflation was about 1.4%. Stocks had an average real return of 6.9%, long-term government bonds 3.6%, short-term government bonds 2.5%, and gold 0.6% for 220 years.
What happens over shorter time periods?
Some investors argue that data spanning centuries isn’t relevant today. So what happens when we examine shorter historical periods?
The surprising finding is consistency.
1926 to 2021: Nearly a century of data
During this 95-year period:
- Inflation averaged 2.9%
- Real stock returns averaged 7.1%
Even across major events like the Great Depression, World War II, and multiple market crashes, stocks continued to deliver strong long-term performance.
Bonds and gold, however, lagged significantly.
Post-World War II: 1946 to 2021
Looking at the modern economic era:
- Real stock returns: 7.3%
- Long-term bond returns: 2%
- Short-term bond returns: nearly zero
- Gold returns: 1.6%
Once again, stocks remained the dominant wealth-building asset class in an era when the dollar reigned supreme. Inflation was 3.7%.
The modern era: 2000 to 2021
The past two decades tell a slightly different story.
During this period:
- Real stock returns fell to about 5.2%
- Long-term bond returns rose to 4.6%
- Gold delivered unusually strong returns of 6.3%
Why?
Because interest rates declined dramatically (about 2.3%), which boosted bond prices and temporarily narrowed the gap between stocks and bonds. When interest rates fall, bond prices rise, so you’re outperforming your bond portfolio. 20 years of falling interest rates mean 20 years of solid performance of your bond portfolio, particularly your long-term bond portfolio.
Why stocks win in the long run
Across all periods studied, one conclusion remains clear: Stocks are the only asset class that consistently deliver significant long-term real returns.
This is why Siegel’s book carries the famous title: Stocks for the Long Run
While bonds provide stability and gold offers crisis protection, neither has historically matched the wealth-building power of equities over the long term.
Click here to get the PDF with all charts and graphs
Andrew’s takeaways
History shows that equities consistently outperform other asset classes after inflation. Investors who remain disciplined and patient benefit from compounding returns over time.
High nominal returns can be misleading if inflation is also high. Long-term investors must focus on inflation-adjusted performance to protect purchasing power.
Siegel also notes an important shift:
- Historically, investors paid about 15× earnings for stocks
- Today’s higher valuations suggest future real returns may be closer to 5% instead of 6–7%
This reflects a world with lower interest rates, higher asset prices, and slower economic growth.
Why this matters for investors today
Understanding long-term stock market returns helps investors:
- Set realistic expectations
- Avoid panic during downturns
- Build diversified portfolios
- Focus on decades, not market cycles
Perhaps most importantly, it reinforces one timeless principle: successful investing is a marathon, not a sprint.
In Siegel’s Stocks for the Long Run, he tells us to expect a 5% long-term real US stock market return
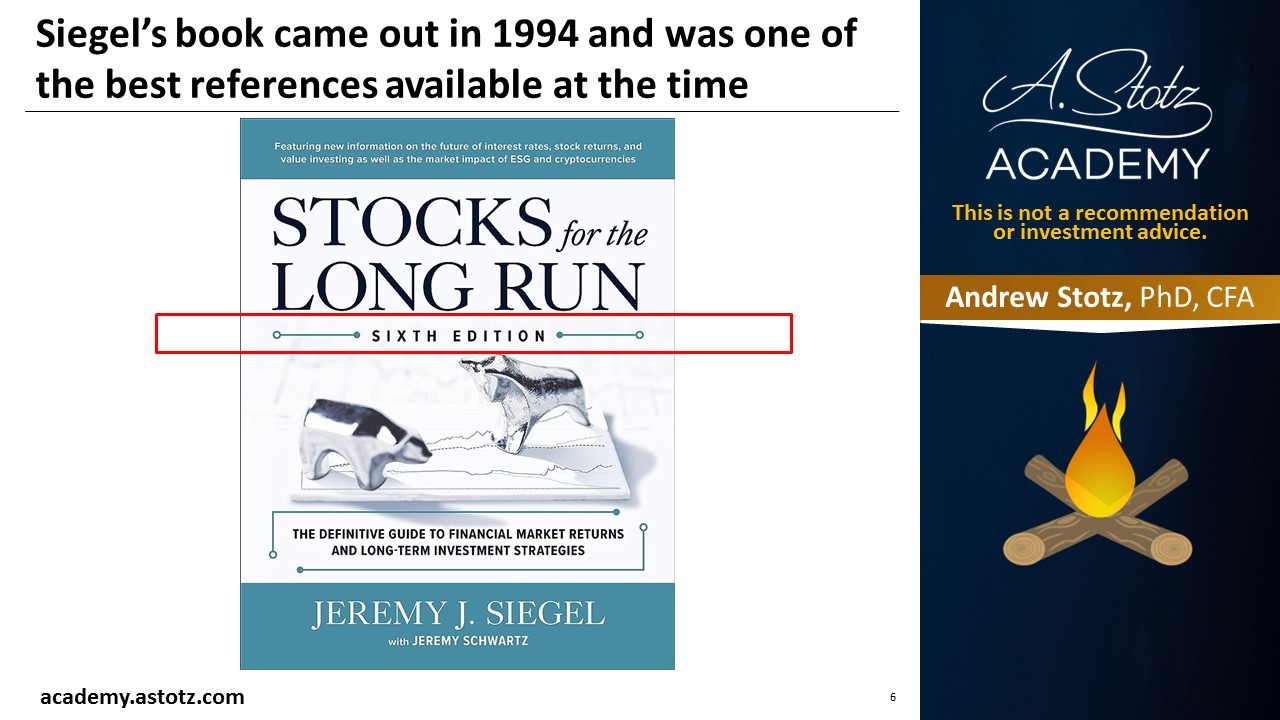
I became a finance teacher in Thailand in 1992

Then started as a financial analyst in 1993

Siegel’s book came out in 1994 and was one of the best references available at the time
US nominal returns
US real returns
More than 200 years of returns
95 years of returns
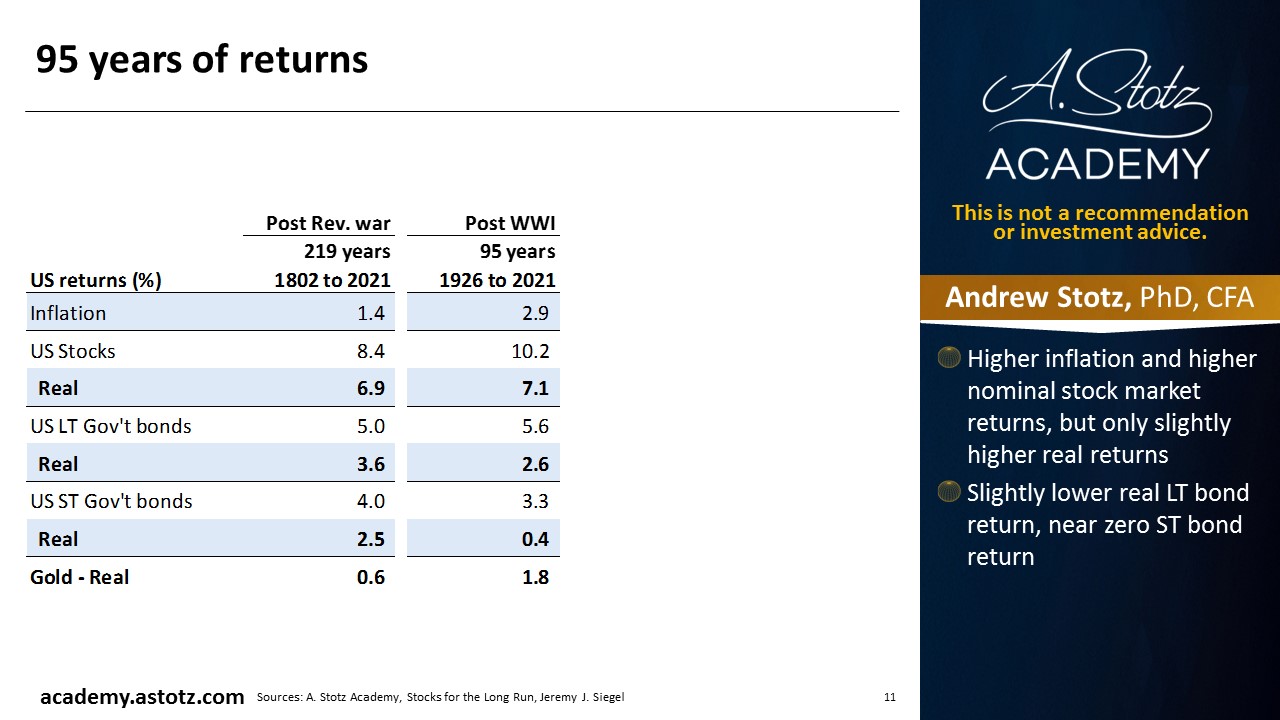
- Higher inflation and higher nominal stock market returns, but only slightly higher real returns
- Slightly lower real LT bond return, near zero ST bond return
Post WWII/Bretton Woods 75 years of high inflation
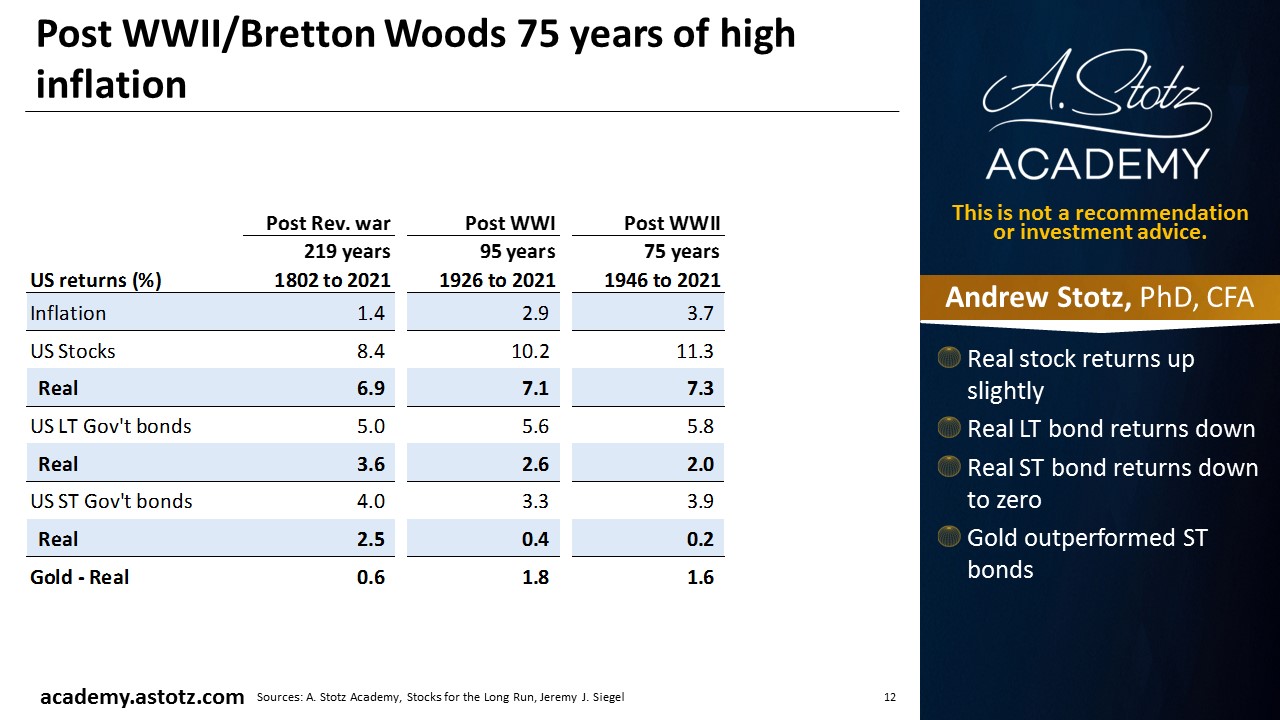
- Real stock returns up slightly
- Real LT bond returns down
- Real ST bond returns down to zero
- Gold outperformed ST bonds
The 21 years after the Dot Com bubble saw an unprecedented level of globalization
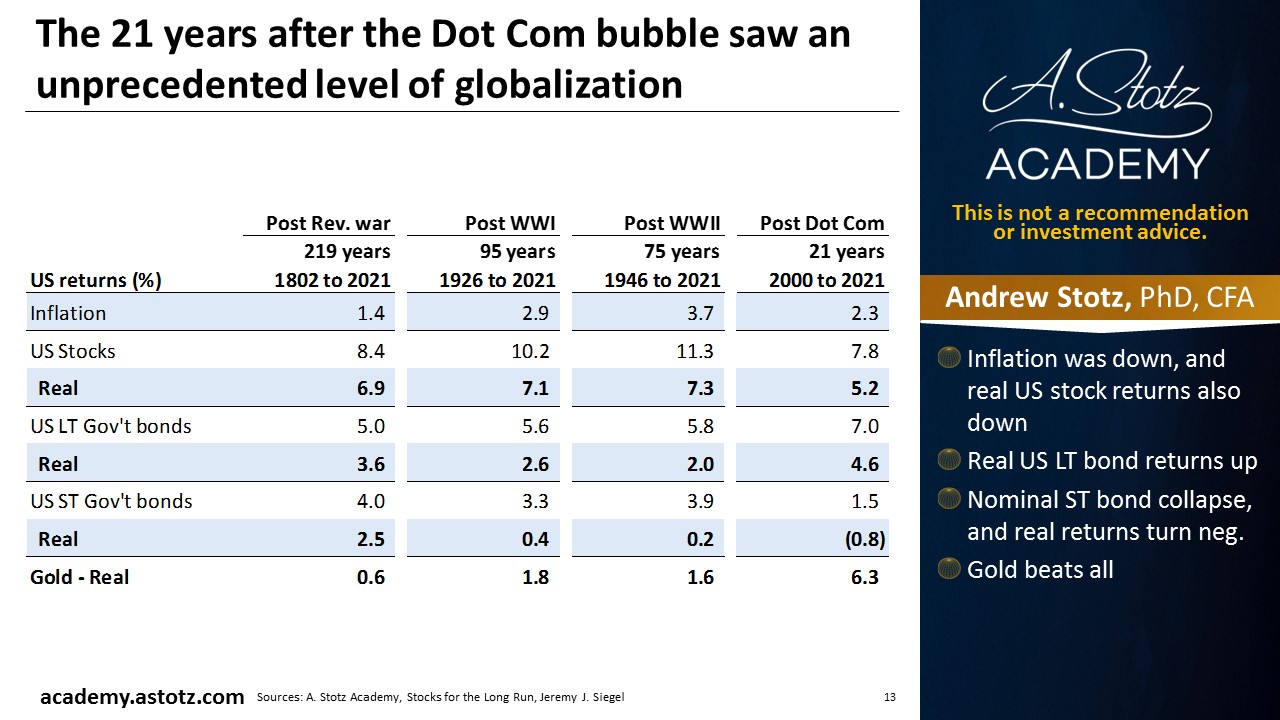
- Inflation was down, and real US stock returns also down
- Real US LT bond returns up
- Nominal ST bond collapse, and real returns turn neg.
- Gold beats all
Siegel’s advice
- Over the long-term, an investor has paid about 15x PE for about 6-7% after inflation US stock market return
- In the future, expect to pay about 20x PE for about 5% after inflation return
Click here to get the PDF with all charts and graphs
Andrew Stotz 00:00
Hello fellow risk takers and welcome to my worst investment ever stories of loss to keep you winning. In our community. We know that to win an investing, you must take risk but to win big, you've got to reduce it. Ladies and gentlemen, I'm on a mission to help 1 million people reduce risk in their lives. Join me go to my worst investment ever.com Right now, fellow risk takers this is your worst podcast host Andrew Stotz, from a Stotz Academy, and today, I'm talking about a book that has landed on my desk. It's called stocks for the long run by Jeremy Siegel. Before I go into what we can take away from this book, I want to ask you a question. What is the long term return that you are expecting for US stocks? Is it 2%? Is it 20%? Is it 5%? Is it 15? Is it 10? What are you expecting for the long term women taught long term we're talking about 2050 years? Well, think about that. Write that down. If you're not driving, get that number clear in your head before we start, so that you're not overwhelmed by the information here and you are able to compare your estimate. Alright, you've got your estimate. Now let's compare it to what Siegel tells us in his book, Siegel tells us to expect a 5% long term real US stock market return. I'm going to explain that in more detail in just a moment. Now I became a finance teacher in Thailand in 1992. And then I took a job as a financial analyst in 1993, I continued to teach all my career just not full time. Siegel's book came out in 1994. Originally, that was the first edition where he was looking at data going back as long as he could find data, and then up to 1992. Today, what's arrived on my desk is the sixth edition. And I've just really enjoyed going through it. But what I recall when this first came out was that as an analyst in Thailand, there was no internet. And we didn't have libraries or bookstores at that time, particularly English language ones in Bangkok. So it was hard to get books and information about stock market returns. And so I found this book on one of my trips, and I bought it and brought it back to Bangkok and I devoured it. Now I want to start off with a chart. That's one of the first charts that he shows in the book. And it shows the US nominal returns, and I'm going to focus right now on stocks, what he shows is going back to 1801. So just about the time when the US was founded, which I believe was 1778, or 87, I can't remember. But at the end of the 1700s, if you had invested $1. In stock market returns in beneva, to get the stock market return. And you had held that until 2021, that $1 would have been worth $54 million. Now, it gets a little bit tricky there because that is what's called a nominal return. Once we take away the impact of inflation, instead of being an 8.4% return that would grow to $54 million. Once we take away the impact of inflation, which is the real return, it goes down to 6.9%, which means it would have grown to $2.3 million. So which one should we look at 54 million or 2.3, we should look at the 2.3 million and that's the amount that the investment has outpaced inflation. Now, just to give you an idea of on this real return, if you had invested in long term government bonds $1 At that time back in 1801 until 2021, you would have ended up not with $2.3 million, as you did with stocks. But with $2,000. And if you had invested in US government bills, meaning short term interest rates, you were in short term bonds or bills, as we call them, you would have not gotten 2 million from stocks, you would not have gotten 2000 from bonds, but you would have gotten $245. Now, if you had invested in gold at that time, from 1801 until 2021, what would have been your return? What do you think? Higher or lower? Well, in fact, gold would have provided you with only $4 of real return. And gold in fact is not and never has really been a great investment vehicle over the long term. It does help during periods of shocks for sure. Now, you can't see these charts but they're awesome and amazing. And I'm going to have some charts and graphs in this. And all you have to do is just go you can download this chart deck for free by just clicking on get the PDF link at my worst investment ever.com So now, let's look at the first period of time, which is from 1802 to 2021. That's 219 years of information. And from this, what we can see is that over that period of time, inflation was about 1.4%. And stocks had an average annual return of 8.4. So stocks definitely beat inflation. If we take that 8.4. And we subtract the 1.4. And inflation, we're going to get what's called the real stock return. Now, there's some reasons why you can't just subtract the long term inflation rate from the long term stock rate because there's volatility involved in this calculation. But for the simplicity of it, let's just say that 8.4 minus 1.4, so 8.4, US stock market return nominal minus 1.4. Inflation, you get to about 7%, real return was 6.9. So the average annual return was 6.9%. Now let's look at the government bond yield. This is long term government bonds, for 220 years, you would have gotten an average annual return of 5%. But if we back out inflation, it would be down to 3.6. And next, what about short term US government bonds over this period of 220 years, you would have gotten about a 4% average annual return for short term government bonds. If we adjust that for inflation, we see a real US government short term US government bond return of 2.5%. And ultimately, gold has a real positive return of only 0.6%. So now let's focus on those real returns for just a moment. Stocks, 6.9 long term government bonds 3.6, short term government bonds, 2.5, and gold 0.6. These are the average annual returns over the longest period of time that we have. And these are all US returns later, I'm going to come back and look at international returns. But I'm not going to do that in this particular presentation. Now, let's now say okay, come on, Andrew, going back to the 1800s isn't realistic, it was a different world. Okay, let's start after World War One. How about if we start in 1926. And we look at the 95 years from 1926 to 2021. Let's say it's getting close to about 100 year period. What do we see, during this period inflation was 2.9%. And stocks real returns on stocks was 7.1%. So about equal to what it was over the 200 year period. Now, we can look at the US government bonds, and they yielded long term bonds yielded 5.6% nominally. But because inflation was 2.9%, you only got half of that at about 2.6. Real return. And finally, let's look at us short term government bonds. They yielded 3.3% over this 95 year period. But because inflation was high, actually, the real return on US government short term debt was 0.4%, very close to zero. And gold over this period of 95 years from 1926 to 2021, yielded 1.8% average annual return. So let's review this again, if we compare to the 200 year period, inflation was up to 2.9% in the 95 year period from 1926 to 2021. That higher inflation, though, didn't really impact the stock market return because after inflation, stock market return was about 7%. After inflation, long term government bond return was 2.6%. That's a pretty low number. And after inflation, US government short term bonds was 0.4%. Basically, you would have earned almost nothing if you'd bought short term US government bonds. And now, if we look at gold over that period, it returned an average annual return in real return basis of 1.8%. Now, some people say, ah, Andrew, that's too long, 95 years, you're going back to the Great Depression. It's a whole different world these days, and therefore, we should look at the last 75 years, this would be post World War Two. We also know this was the Bretton Woods period of time where the dollar reigned supreme. Okay, let's look at that period. What did we find? We found that from 1946 to 2021, inflation was 3.7%. That's very high inflation during that period. And what was the real stock market return? It was 7.3%. So again, not much change in real stock market returns. What was the real long term government bond returns 2% very low. And what was the real short term government bonds returns 0.2% basically close to zero. Let's look at Gold Gold was 1.6% real return. Alright, so now let's just recap This period post World War Two, that's 75 years from 1946 to 2021. Let's look at the real returns that you would have gotten real return in stocks 7.3% real return and long term government bonds 2% and real return in short term government bonds 0.2% and real return in gold 1.6%. Basically the only asset class of these three, which is stocks, bonds, and gold, the only asset class that produce real significant performance was stocks, stocks, and this is why it's called stocks for the long run, because ultimately, stocks produce way more than bonds and way more than gold. But you now may say, okay, Andrew 75 years is a long period of time, so much has changed over the last couple of decades, that we should only look at the period from 2000 to 2021. Let's call this the post.com. Period, it's the last two decades, let's say 20, some years. So what did we find? Well, first of all, inflation was lower in this past two decades, at about 2.3%. In fact, we know that the Fed was keeping interest rates down to zero for maybe the last 15 years or so. And here, we can see that US stock market returns on a real basis. We're at 5.2%. US long term government return bonds return was at 4.6. So you can see that over the 21 year period stocks and long term government bonds almost had the same real return. How can that be? That's because interest rates were in a long term downtrend. And when interest rates are falling, bond prices rise, and therefore you're outperforming in your bond portfolio. And 20 years of falling interest rates means 20 years of strong performance of your bond portfolio, particularly your long term bond portfolio. The other thing is that because Siegel starting this period of time@the.com bubble, he's also starting at a very high level for the stock market and therefore, we only get about a 5.2% after inflation return. And now let's look at short term government bonds. What happened during that period with interest rates falling? Well, we should have seen outperformance like we saw in US long term government bonds but we didn't see that short term US government bonds had a nominal return of 1.5% and a real return of 0.8%. Negative. So you got negative return on short term government bonds. Why is that? Because the Fed kept the interest rates down so low, that basically they dropped interest rates to zero and they kept it there. And therefore there was only a small period of time where you got outperformance in the short term government bonds, but they quickly repriced, to zero. And, in fact, if you were owning short term government bonds over this period of time, you would have lost money on an average annual return basis. And finally, in the 21 year period, with interest rates going down so low, and we had a lot of stability, it was in fact, an amazing performance for gold up 3.6%. So now, let's recap this post.com period the past 21 years, real returns for stocks 5.2% real return for long term government bonds 4.6% real return for short term government bonds, negative 0.8% and real return for gold 6.3%. And also, let's go back to the 220 year history, because that's where we can really kind of base our thinking. If we look at long term returns over the last 220 years, it's about 6.9% for stocks, 3.6% for long term government bonds, and 2.5% for short term government bonds, and 0.1% for gold. That's a lot of stuff. And remember that you can access this chart deck by just going to my worst investment ever.com And say get the PDF. I just want to wrap up by saying that Seagull ended with some advice and I'm gonna go through some of his recommendations in more detail. But for right now, what I wanted to just do is say, he says over the long term investor has paid about 15 times PE for about six to 7% after inflation stock market return in the future, we should expect to pay about 20 times PE for about 5% After inflation return. That wraps up the first part of this book and I'll be talking more about it but feel free to download the PDF so that you got all the information. Fellow risk takers. I'll see you on the upside.
Andrew’s books
- How to Start Building Your Wealth Investing in the Stock Market
- My Worst Investment Ever
- 9 Valuation Mistakes and How to Avoid Them
- Transform Your Business with Dr.Deming’s 14 Points
Andrew’s online programs
- Valuation Master Class
- The Become a Better Investor Community
- How to Start Building Your Wealth Investing in the Stock Market
- Finance Made Ridiculously Simple
- FVMR Investing: Quantamental Investing Across the World
- Become a Great Presenter and Increase Your Influence
- Transform Your Business with Dr. Deming’s 14 Points
- Achieve Your Goals
Connect with Andrew Stotz:

About the show & host, Andrew Stotz
Welcome to My Worst Investment Ever podcast hosted by Your Worst Podcast Host, Andrew Stotz, where you will hear stories of loss to keep you winning. In our community, we know that to win in investing you must take the risk, but to win big, you’ve got to reduce it.
Your Worst Podcast Host, Andrew Stotz, Ph.D., CFA, is also the CEO of A. Stotz Investment Research and A. Stotz Academy, which helps people create, grow, measure, and protect their wealth.